Practical answers from our engineers
Over many years, Prosig's engineers have written hundreds of articles on noise and vibration measurement, from the basics of sensors and sampling to advanced analysis techniques. They're a practical reference for anyone working with test data, whether or not you use Prosig systems.
A simple frequency response function
A look at the basic concepts and theory.
The following article will attempt to explain the basic theory of the frequency response function. This basic theory will then be used to calculate the frequency response function between two points on a structure using an accelerometer to measure the response and a force gauge hammer to measure the excitation.
Fundamentally, a frequency response function is a mathematical representation of the relationship between the input and the output of a system.
So, for example, we can measure the frequency response function between two points on a structure. It would be possible to attach an accelerometer at a particular point and excite the structure at another point with a force gauge instrumented hammer. Then by measuring the excitation force and the response acceleration the resulting frequency response function would describe as a function of frequency the relationship between those two points on the structure.
The basic formula for a frequency response function is:
H(f) = Y(f) / X(f)
Where H(f) is the frequency response function, Y(f) is the output of the system in the frequency domain and X(f) is the input to the system in the frequency domain.
H1(f) and H2(f)
Frequency response functions are most commonly used for single input and single output analysis, normally for the calculation of the H1(f) or H2(f) frequency response functions. These are used extensively for hammer impact analysis or resonance analysis. The H1(f) frequency response function is used in situations where the output to the system is expected to be noisy when compared to the input. The H2(f) frequency response function is used in situations where the input to the system is expected to be noisy when compared to the output. Additionally there are other possibilities, but they are outside of the scope of this article. H1(f) or H2(f) can be used for resonance analysis or hammer impact analysis. H2(f) is most commonly used with random excitation.
The breakdown of H1(f) is as follows:
H1(f) = Sxy(f) / Sxx(f)
Where H1(f) is the frequency response function, Sxy(f) is the Cross Spectral Density in the frequency domain of X(t) and Y(t), and Sxx(f) is the Auto Spectral Density in the frequency domain of X(t).
In very basic terms, the frequency response function can be described as:
H1(f) = Cross Spectral Density of the Input and Output / Auto Spectral Density of the Input
The breakdown of H2(f) therefore is as follows:
H2(f) = Syy(f) / Syx(f)
Where H2(f) is the frequency response function, Syx(f) is the cross-spectral density in the frequency domain of Y(t) and X(t), and Syy(f) is the auto-spectral density in the frequency domain of Y(t).
In very basic terms, the frequency response function can be described as:
H2(f) = Auto Spectral Density of the Output / Cross Spectral Density of the Input and Output
A worked example
In the following example, we will discuss and show the calculation of the H1(f) frequency response function. The excitation or input would be the force gauge instrumented hammer, as shown in Figure 1, as a time history. In this case, the response or output would be the accelerometer, as shown in Figure 2.
Figure 1: X(t)
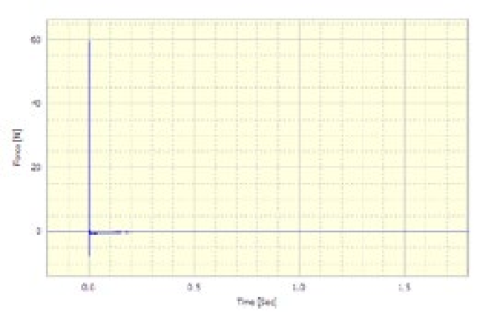
Figure 2: Y(t)
However, as discussed earlier, the frequency response function is a frequency domain analysis; therefore, the input and the output to the system must also be frequency spectra. So the force and acceleration must first be converted into spectra.
The first part of the analysis requires the Cross Spectral Density of the input and output; this is Sxy(f). This is calculated using the response as the first input and the excitation as the second input to the Cross Spectral Density Analysis in DATS. The result is shown in Figure 3. Were Sxy(f) being calculated for use with H2(f), for example, then the excitation would be the first input and the response the second input to the Cross Spectral Density Analysis in DATS.
Figure 3: Sxy(f)
Next, the Auto Spectral Density of the input, or excitation signal, is required. This is calculated using the Auto Spectral Density Analysis in DATS (this analysis is sometimes known as Auto Power), the result of which is shown in Figure 4; this is Sxx(f).
Figure 4: Sxx(f)
The Cross Spectrum is then divided by the Auto Spectrum, and the resulting frequency response function is shown in Figure 5. The response function would normally be shown in modulus and phase form, as shown in Figure 6.
Figure 5: H1(f)
Figure 6: H1(f) shown as modulus and phase
The entire analysis as used in DATS-toolbox is shown in Figure 7; the data flow from the original input and output, force and response, can be seen through to the frequency response function. The DATS software does, of course, provide a single-step transfer function analysis. We have deliberately used the long-hand form here to illustrate the steps in this article.
Figure 7: Complete DATS worksheet
It is necessary to understand that, for the purposes of clarity in this article, some important steps have been glossed over, for example, windowing of the input. This is to assist in the basic understanding of the frequency response function.
Have a question about this article? Email our support team
Browse all articles
Our full library of articles, tutorials and how-tos is available on the Prosig Noise and Vibration Blog.
How impact hammer testing reveals a structure's natural frequencies, damping and mode shapes, and how to get reliable results.
Why you might change the sample rate of your data, and how to do it without introducing errors such as aliasing.
What a frequency response function is, how it's measured, and how to read one to understand a structure's behaviour.
How acceleration, velocity and displacement relate to each other, with simple conversion formulas and the pitfalls to avoid.
A guide to measurement microphones: free-field, pressure and random-incidence responses, polarisation and size, and how to choose the right one.
Why window functions change the values in your spectrum, and when to apply amplitude correction or energy correction.
Have a question we haven't answered?
Get the latest DATS software updates and patches for your licensed system.
Watch Prosig systems in action, with tutorials and explainer videos on our YouTube channel.
Open and view DATS data files with our free viewer, no licence needed.
Our free 7th edition guide to sensors, measurement and analysis.
Tell us how we’re doing. Your feedback helps us improve our products and support.

From aerospace and automotive testing to condition monitoring and human vibration research, explore how Prosig's measurement solutions are applied across demanding engineering environments.
Worldwide support, local expertise
Our support team is based in the UK, with offices in the USA and a network of distributors worldwide providing local sales and support.

Our sites

Distributors